


I personally use EasyWebinar and they are the best. I moved from using other platforms and nothing compares to their reliability and customer support!
Amy Porterfield
Online Marketing Expert
Build and Launch in Minutes
Watch a quick walkthrough
One Platform. Every Webinar Journey.
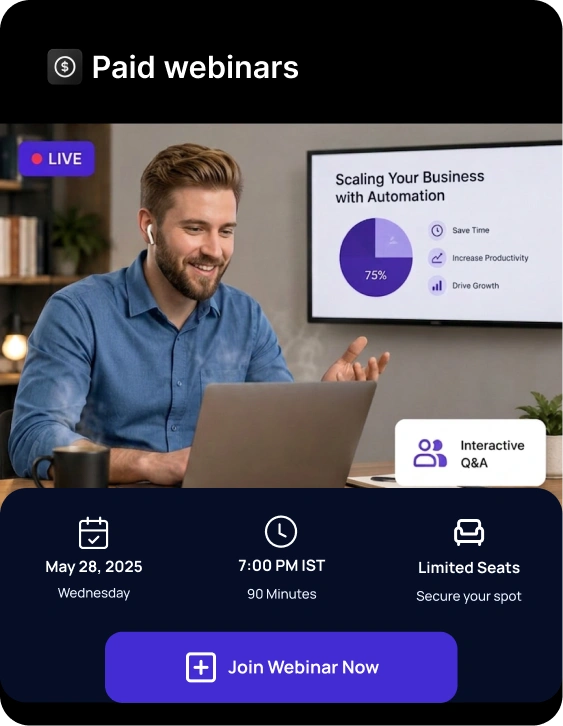
Businesses, educators, SaaS teams, coaches, agencies, and enterprises use EasyWebinar to run live, automated, simulive, and evergreen webinars that generate leads, deliver premium attendee experiences, and drive conversions at scale.
The most loved webinar platform for scaling revenue


Automated Revenue Funnel
$2M
from one automated webinar funnel

Ryan Fenn,
CEO of ChiirP
Marketing ROI
166%
ROI on webinar spend

Rick Mulready,
Online Marketing Expert
Webinar-Led Sales
$750K
in revenue generated from a single webinar funnel

Kim Constable,
Founder of The Sculpted Vegan
The most loved webinar platform for scaling revenue
Automated Revenue Funnel
$2M
from one automated webinar funnel
Ryan Fenn,
CEO of ChiirP
Marketing ROI
166%
ROI on webinar spend
Rick Mulready,
Online Marketing Expert
Webinar-Led Sales
$750K
in revenue generated from a single webinar funnel
Kim Constable,
Founder of The Sculpted Vegan
Most teams stitch together one tool for hosting, another for registration, another for email, another for CRM, another for payments, and another for analytics. EasyWebinar brings the full journey together.
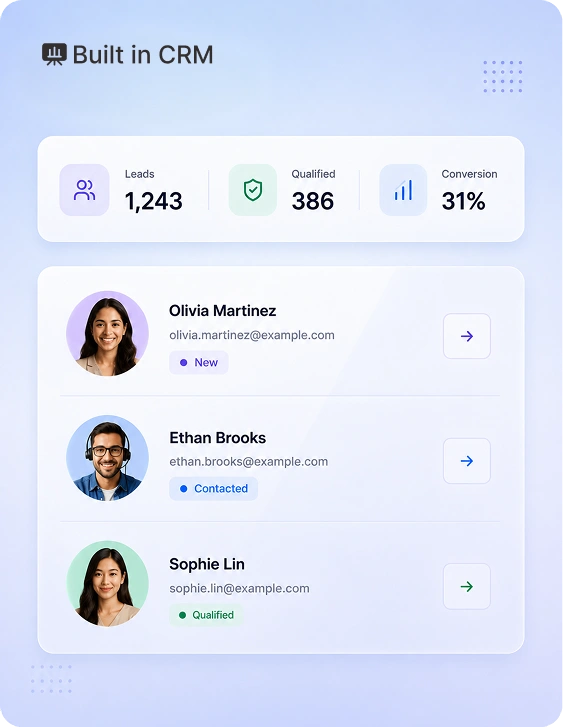
Marketing, sales, product, and customer success teams all need webinar data — but disconnected tools make it hard to know who registered, attended, engaged, and is ready for follow-up.
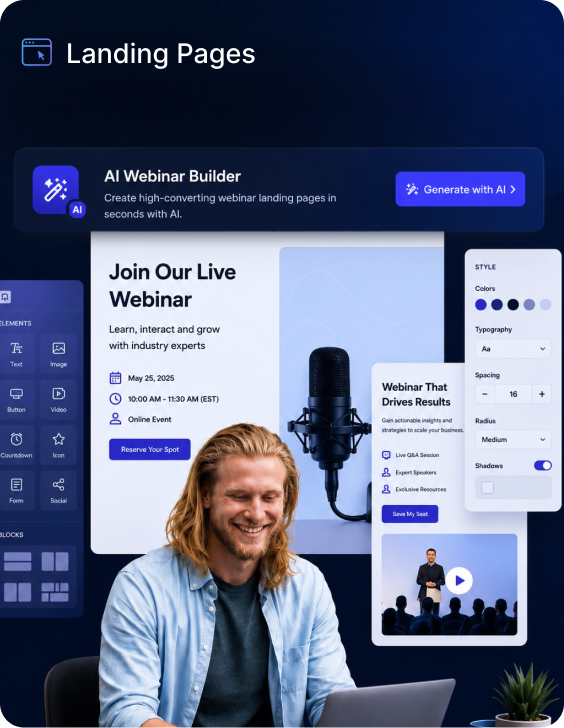
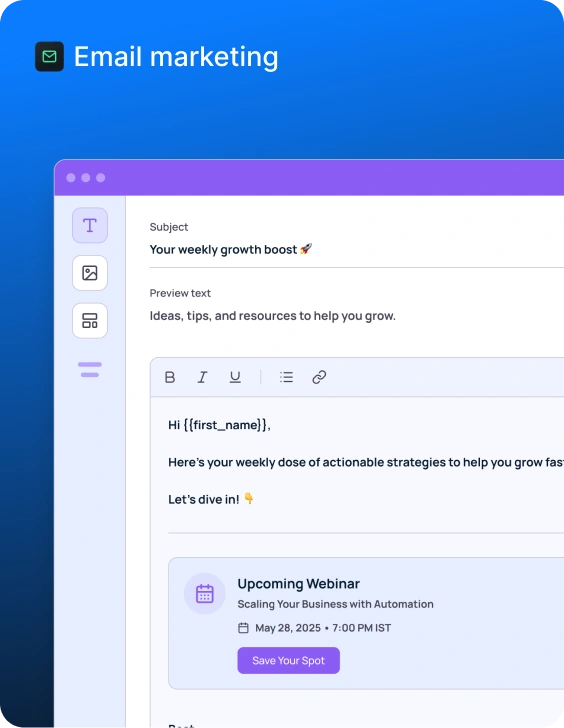
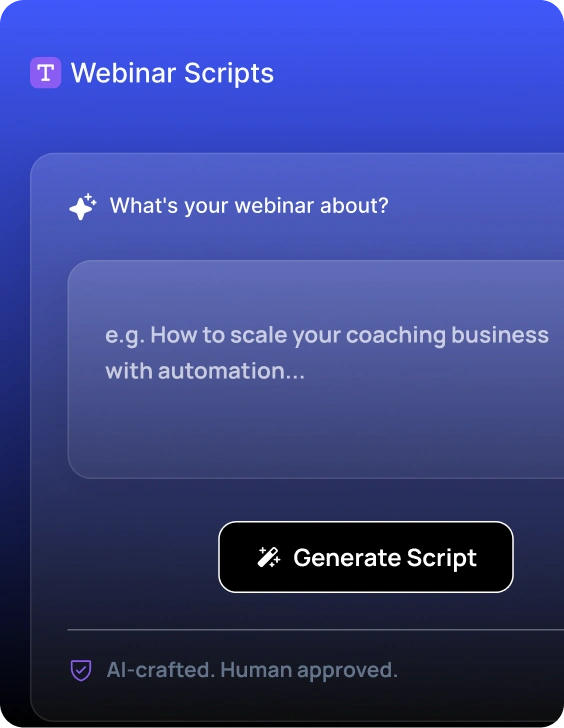
Building pages, emails, live sessions, replays, CRM workflows, and follow-up can take weeks. EasyWebinar helps teams launch faster with AI-generated assets and built-in workflows.
Webinar hosting, landing pages, CRM, email, video hosting, checkout, automation, and multistreaming all add up. EasyWebinar helps replace multiple tools with one connected platform.
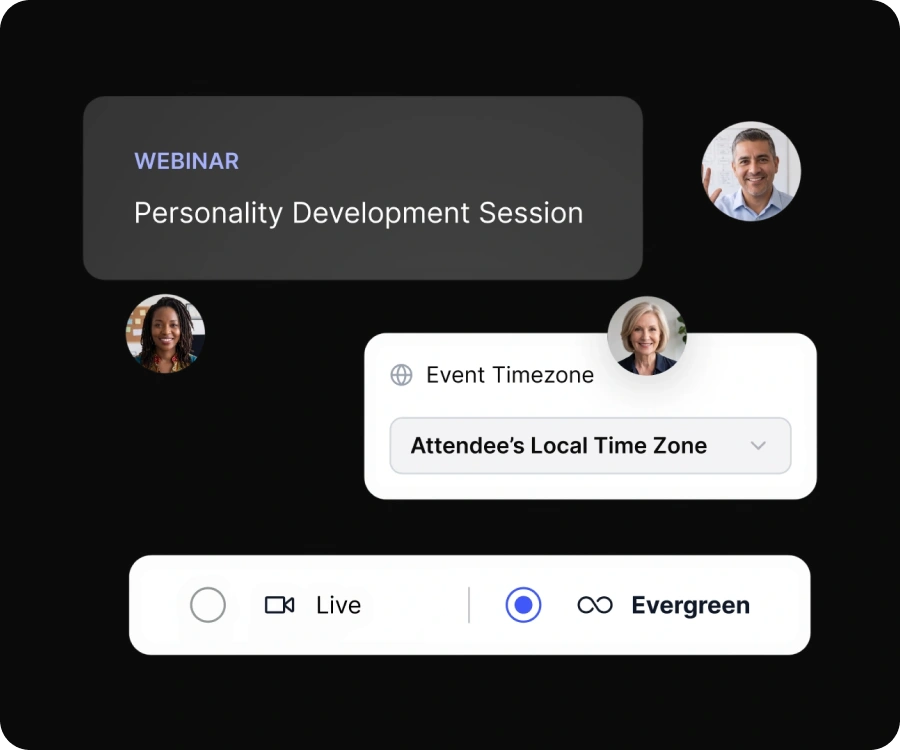
Every time you want to make money, you have to schedule a session, show up & hope the timing works for your audience.
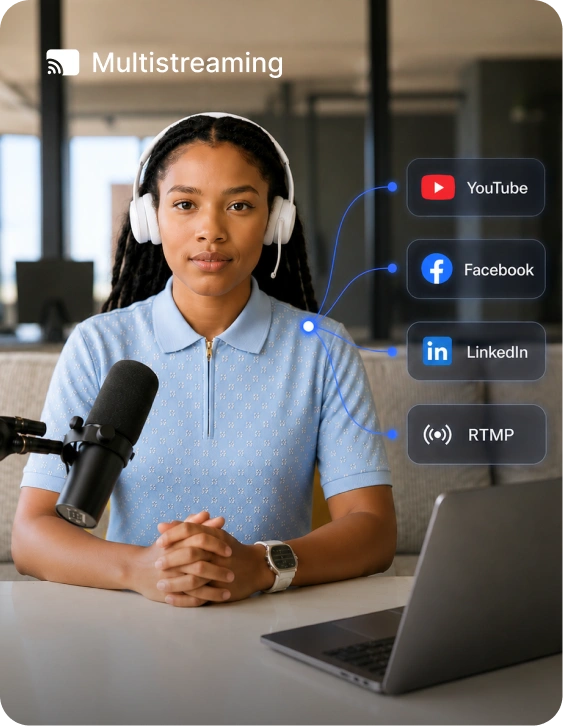
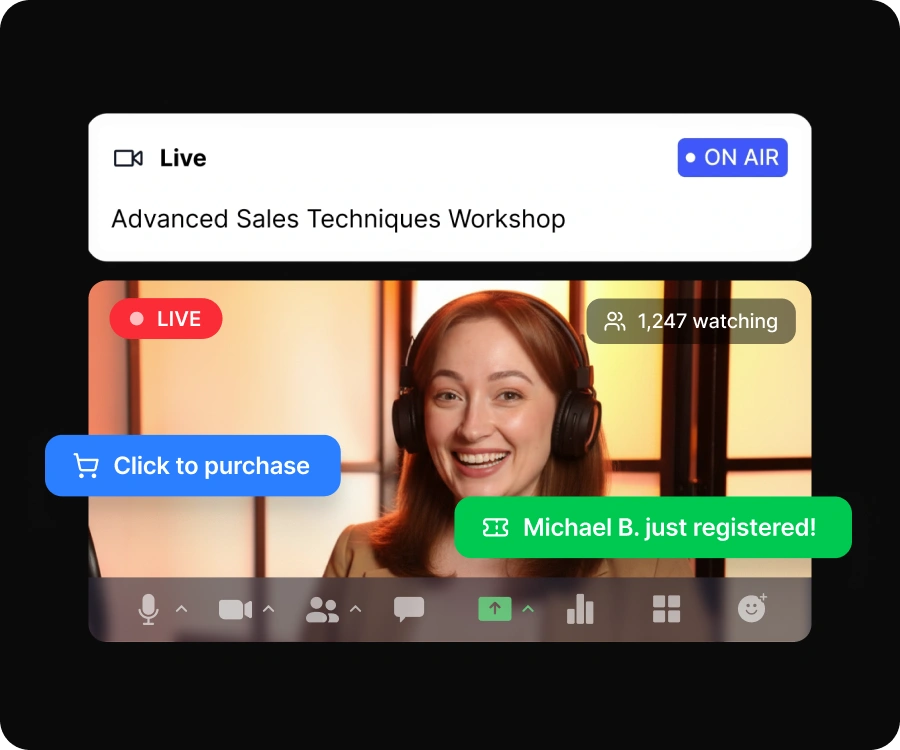
Go beyond a single webinar room. Multistream to YouTube, Facebook, LinkedIn, and other channels while keeping registration, engagement, and conversion data connected.
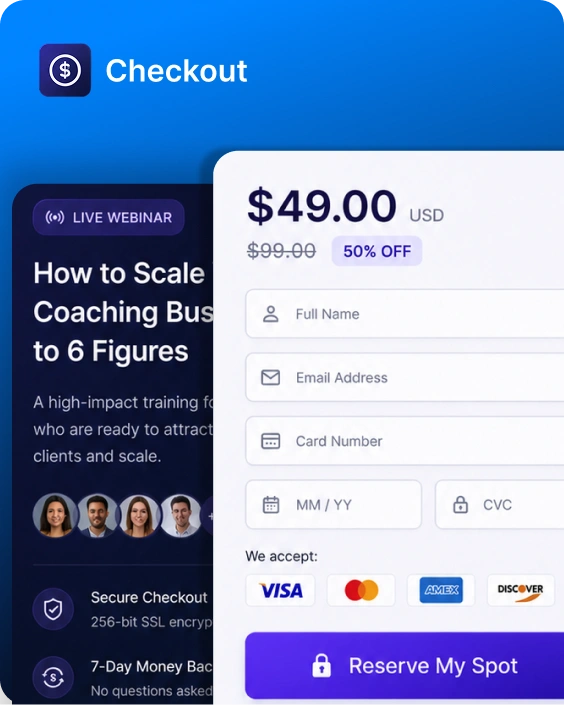
Whether someone is booking a demo, buying a course, joining a paid workshop, or speaking with sales, every extra handoff creates friction. Keep the journey connected from first click to final conversion.
From AI-powered setup to live delivery, automated replays, CRM follow-up, and revenue analytics, EasyWebinar helps teams turn webinars into a repeatable growth channel.
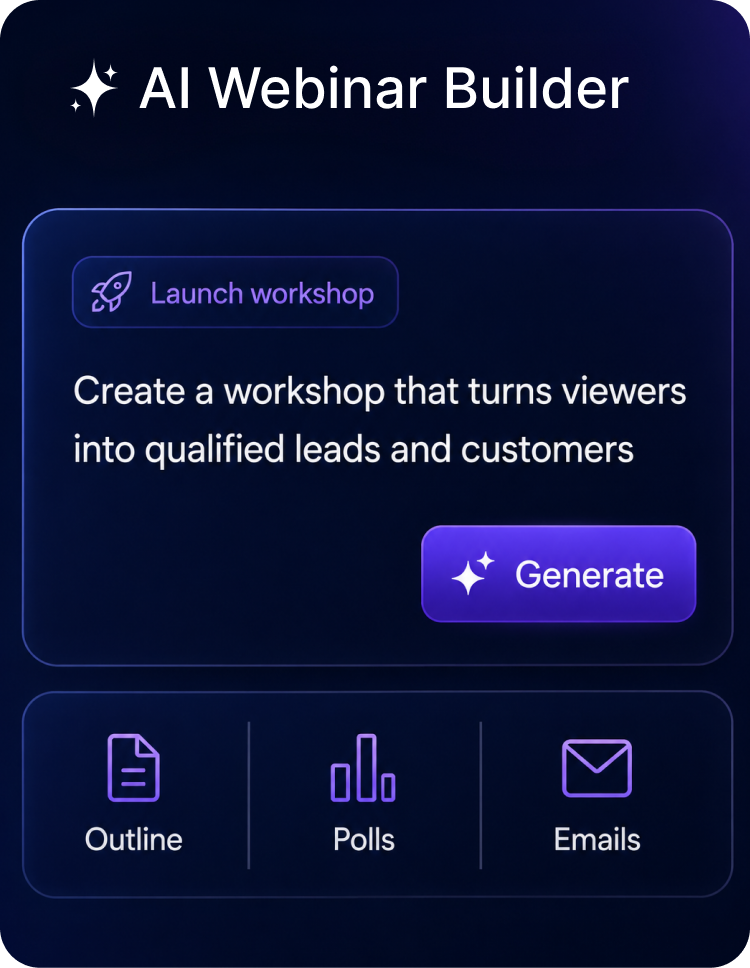
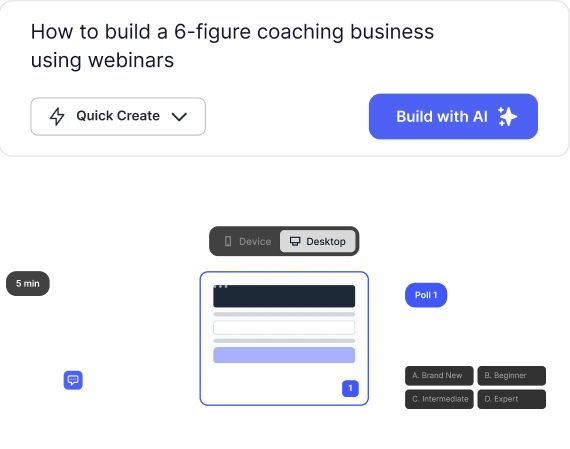
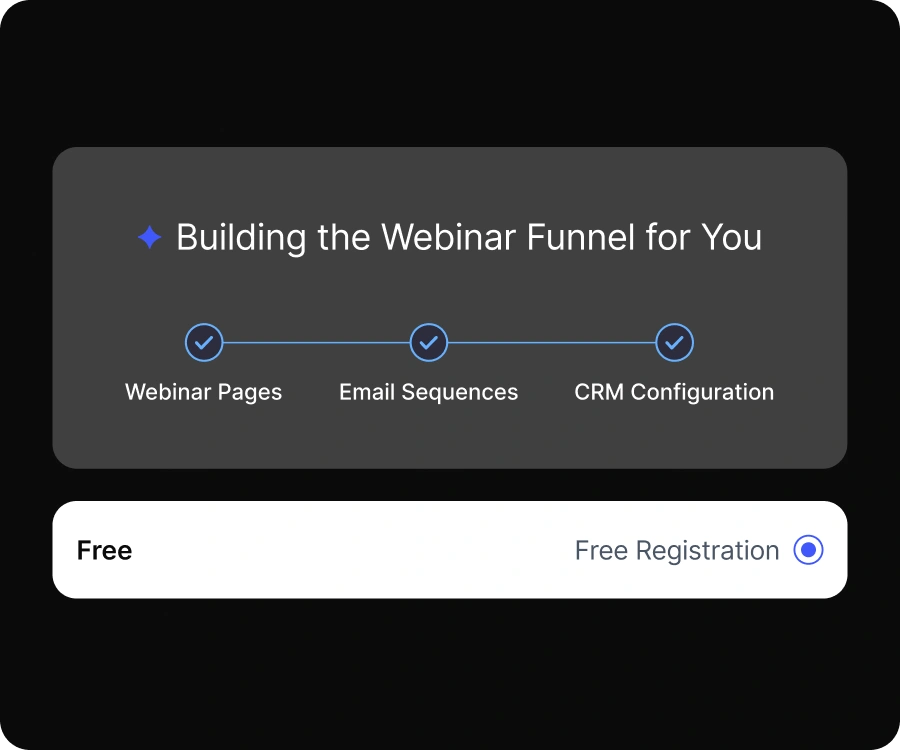
Go from idea to complete webinar journey with AI. Create the assets your team needs to run live webinars, product demos, training sessions, onboarding flows, and evergreen campaigns.
7-day full access. Cancel anytime.
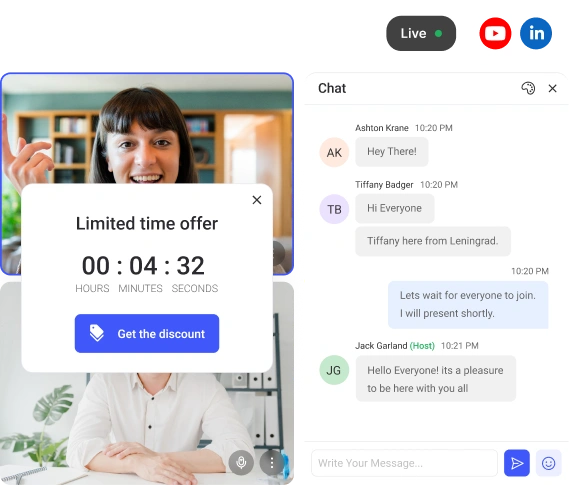
Multistream to YouTube, Facebook, LinkedIn, and RTMP destinations.
7-day full access. Cancel anytime.
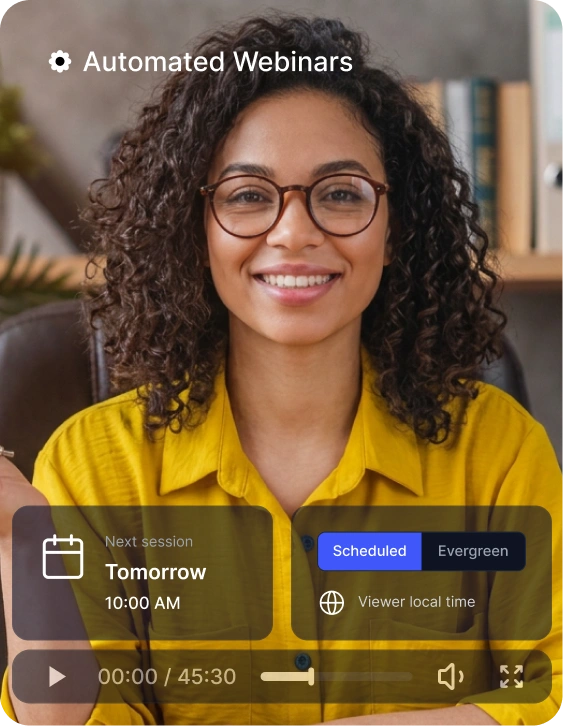
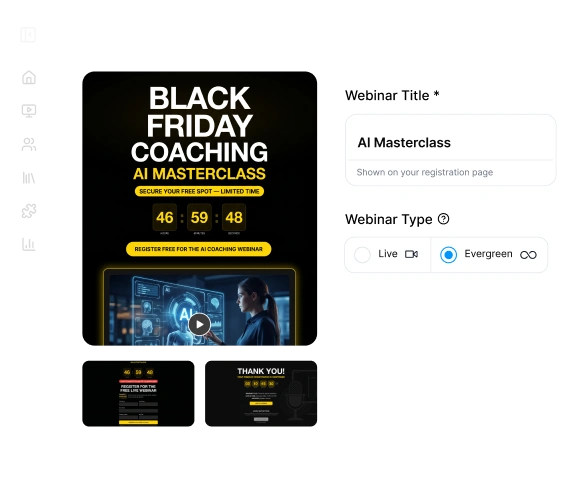
Turn your best live webinars, product demos, customer trainings, and sales presentations into automated, evergreen, and on-demand experiences that work across every time zone.
7-day full access. Cancel anytime.
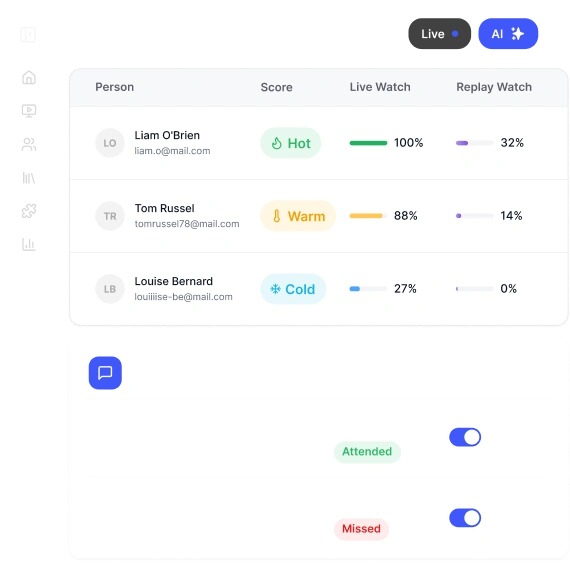
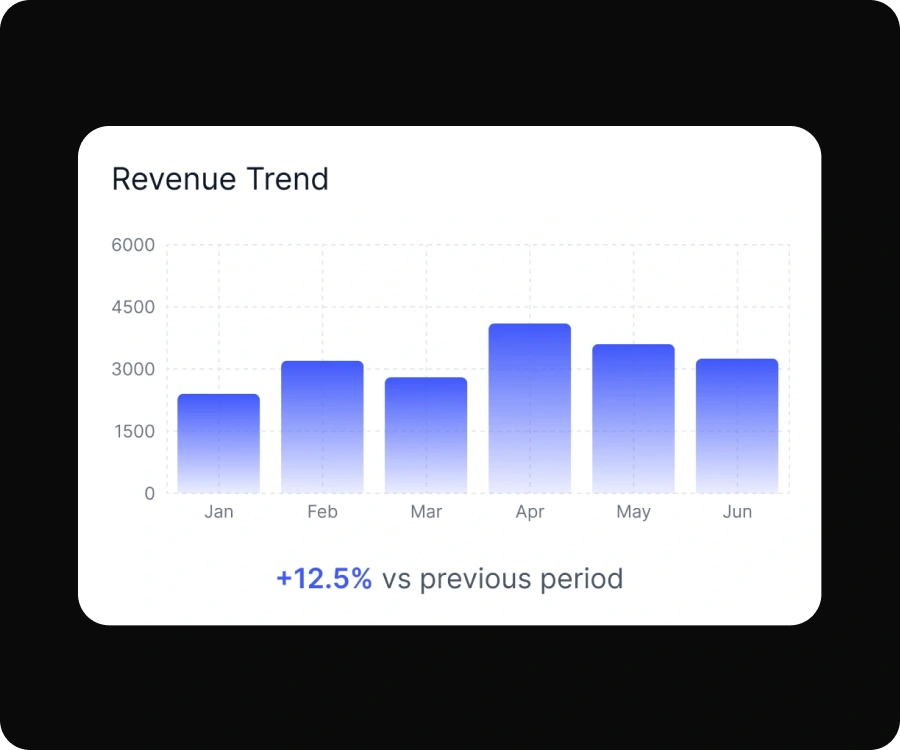
Track every registrant and attendee across the webinar journey, so your team can see who registered, attended, watched, clicked, asked questions, viewed offers, joined replays, or showed buying intent.
7-day full access. Cancel anytime.
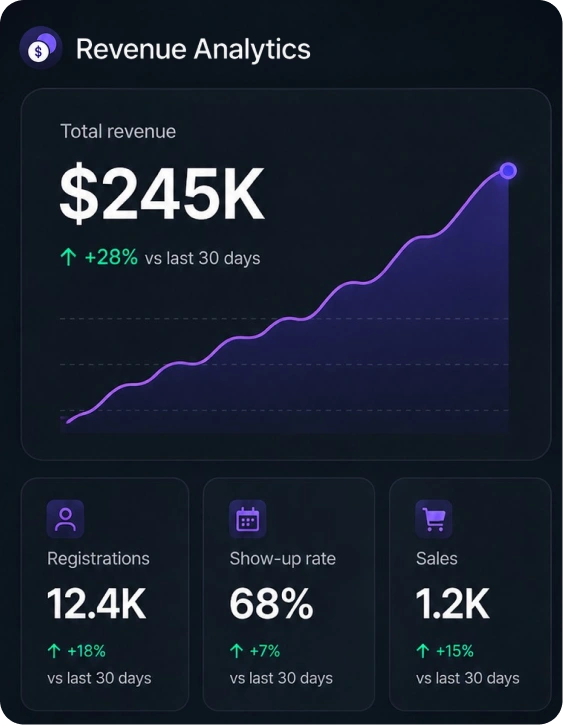
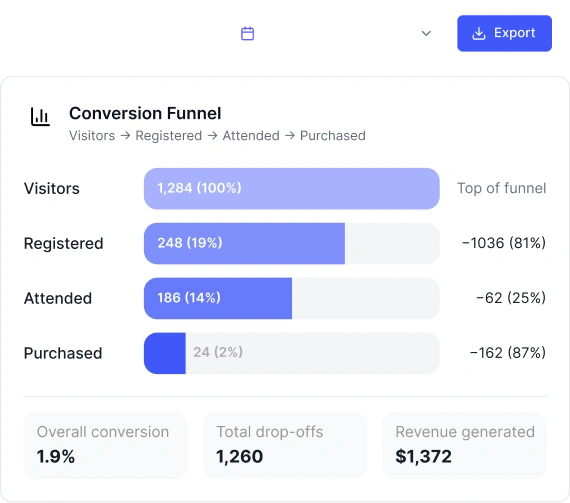
Track the full path from registration to attendance, engagement, replay views, CTA clicks, purchases, demo interest, and follow-up actions — so every team can improve the next webinar.
7-day full access. Cancel anytime.
Connects to your stack
Send webinar registrations, attendance, engagement, CTA clicks, purchases, replay activity, and conversion data into the tools your sales, marketing, product, operations, and customer success teams already use.
How does it work?
Step 01
Full funnel ready, before your coffee gets cold.
You write every asset.
AI trained on hundreds of webinars.
Step 02
Validate your offer with a real audience before you automate.
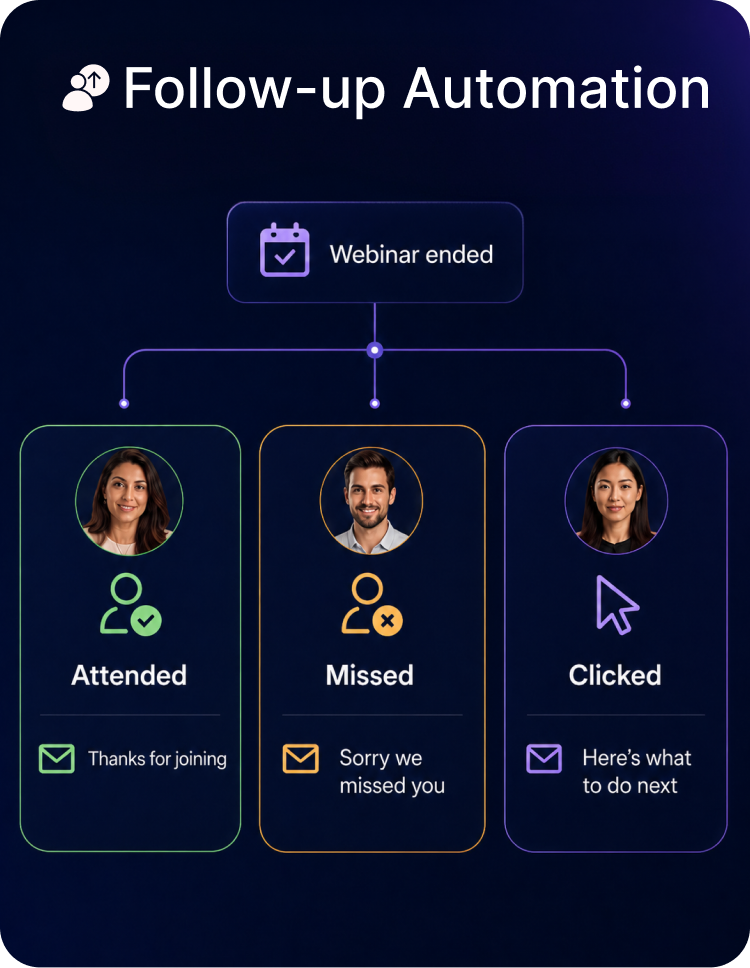
Same reminder to all
Behavior-based triggers
Step 03
One click turns your best session into a 24/7 sales machine.
Fixed schedule
On-demand
Evergreen
Just-in-time
Simulive
Step 04
Drive leads in. Let the funnel close them.
Limited to hosting. No revenue.
Supports revenue, 24/7
EasyWebinar helps teams turn live sessions, automated webinars, product demos, trainings, and evergreen funnels into measurable business outcomes.

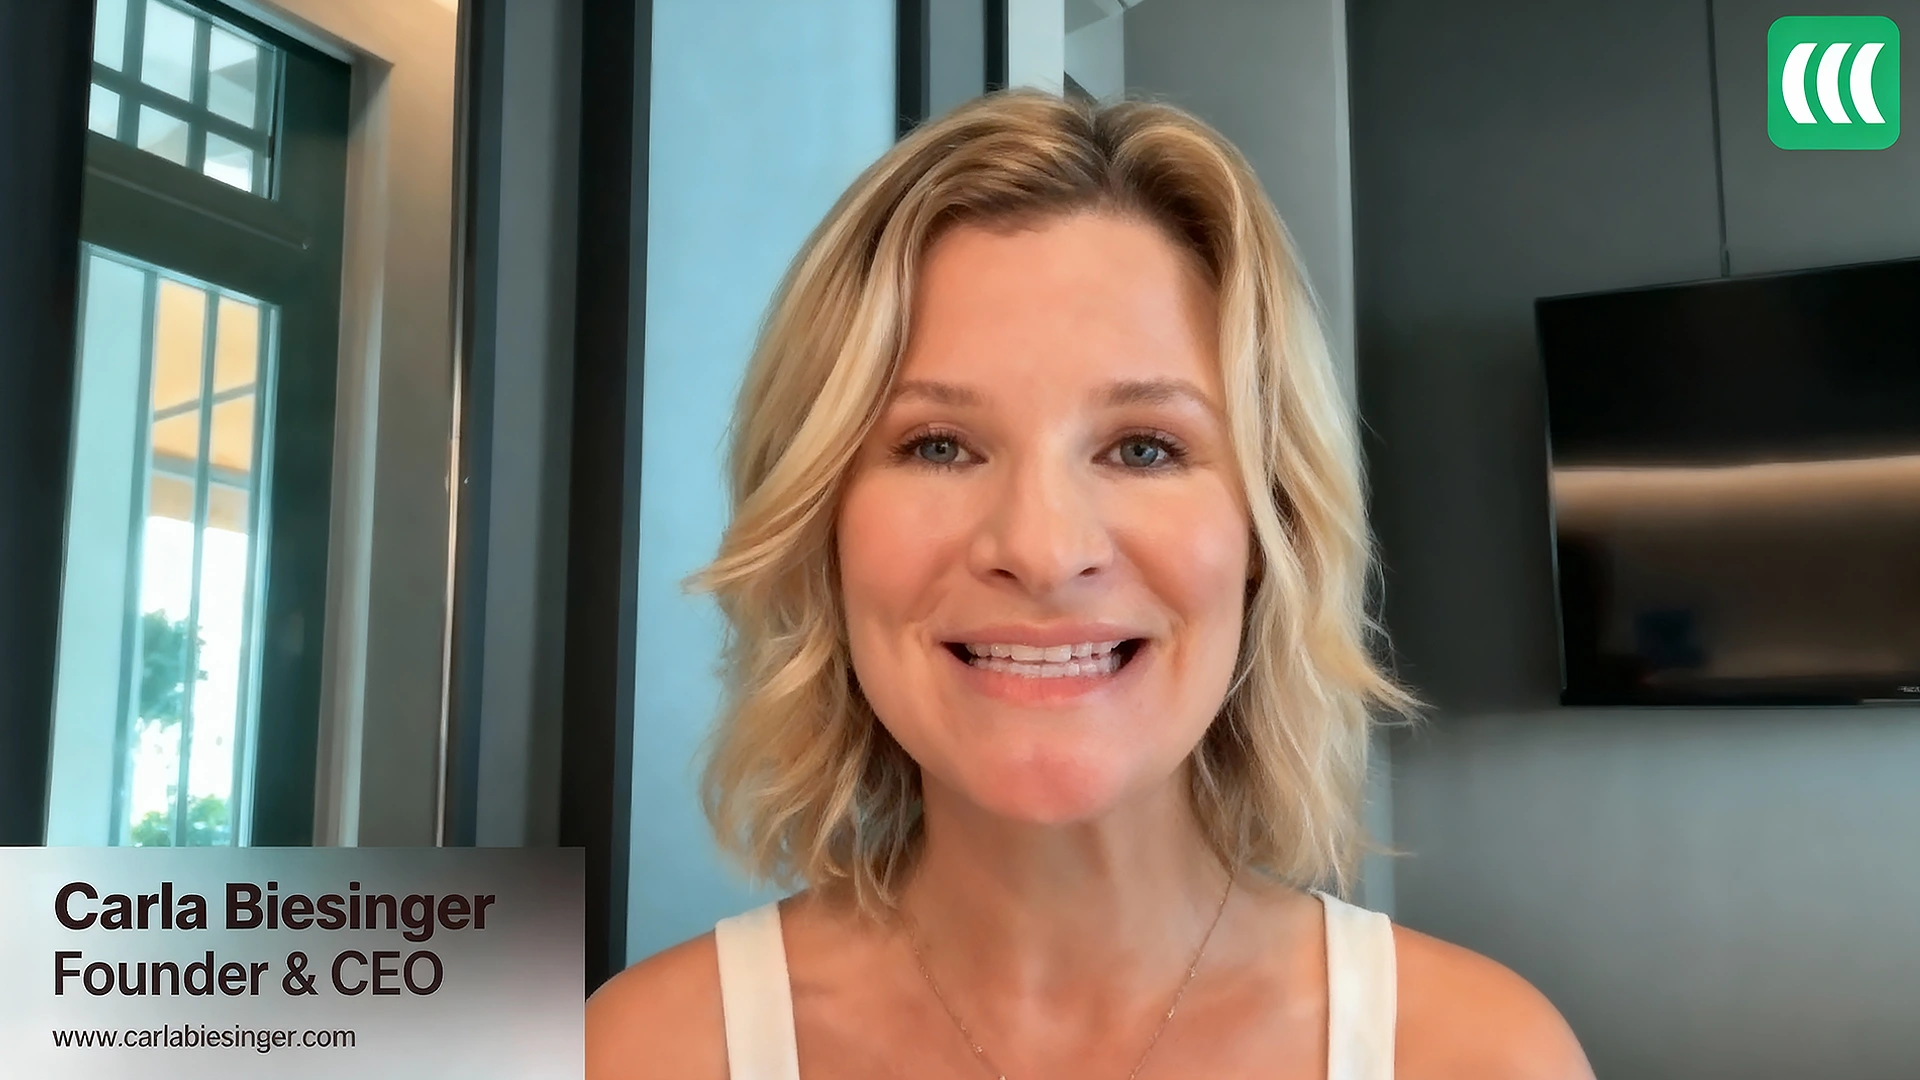
Carla Biesinger
Founder & CEO
+183%
Increase in replay engagement
Increase in replay engagement from an automated webinar system.

Dr. Gregory M. Fryer
MD Medical Direct Care
+387%
Increase in show up rate
Increase in show-up rate for a healthcare business using webinars to educate and grow.
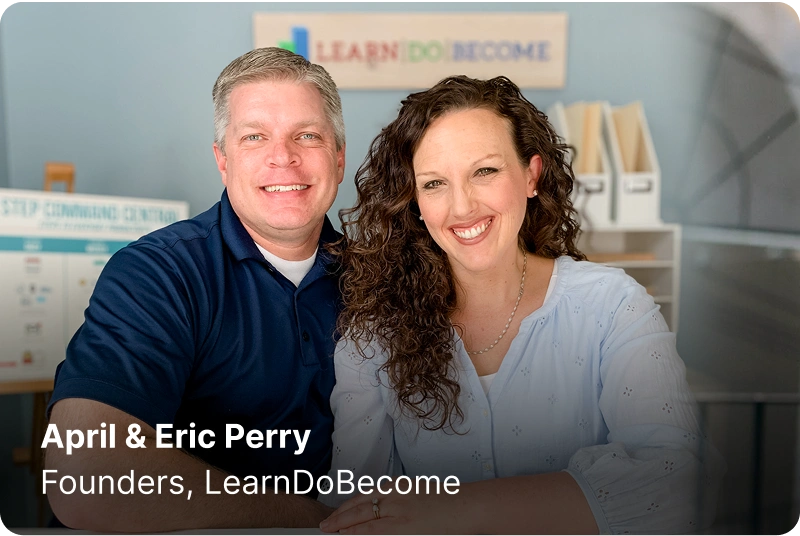
April & Eric Perry
Founders, LearnDoBecome
+185%
increase in replay views
On-demand webinar replays made it easier for their target audience of busy parents.
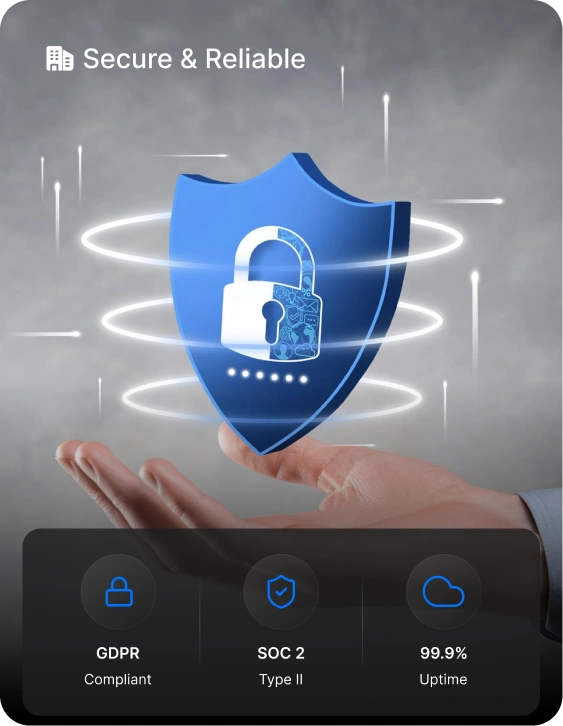
EasyWebinar gives business and enterprise teams the reliability, security, identity controls, compliance support, and scalability they need to run webinars across marketing, sales, product, training, customer education, and internal communications.
Security controls validated through third-party audit.
Support for privacy-conscious webinar programs and global audiences.
Enterprise identity, access, and user provisioning support.
Reliable webinar delivery with named SLA options for Enterprise.
Keep the price comparison clear while showing the broader value: EasyWebinar brings live webinars, automation, demos, onboarding, training, CRM follow-up, payments, analytics, and multistreaming into one connected platform.
EasyWebinar Growth
One AI-Native Webinar Platform to run, automate, convert, and measure webinars.
Replaces

Representative third-party tool pricing shown for comparison only. Actual costs may vary by plan, usage, billing cycle, and add-ons.
SUCCESS STORIES
“$5M generated from one evergreen webinar funnel as Carla scaled from small live events to a fully automated system with smart scheduling and seamless integrations.”
I personally use EasyWebinar and they are the best. I moved from using other platforms and nothing compares to their reliability and customer support!
Amy Porterfield
Online Marketing Expert

The name is completely self-explanatory. Easiest integrations, best customer service, and EASY to use
Susie Moore
Author/Lifecoach

It's been over 5 years and that speaks for itself. I haven't had to go look for another competitor.
Jason Brown
Stock Market Coach
Everything you need to know about EasyWebinar. Can't find the answer you're looking for? Reach out to our support team.
EasyWebinar is an AI-powered, conversion-focused webinar platform that helps businesses create, host, automate, and optimize live, automated, simulive, evergreen, and paid webinars. Teams use EasyWebinar for lead generation, product demos, customer onboarding, training, online workshops, customer education, sales enablement, and revenue growth.
One platform for live webinars, automated funnels, EasyCast multistreaming, built-in CRM workflows, AI setup, and revenue analytics.
7-day full access. Cancel anytime.