Webinar Analytics & Statistics: Key Metrics to Track in 2026
Q1: What Do the 2026 Webinar Statistics Reveal at a Glance?
The 2026 webinar benchmarks that matter are simple: attendance rates have climbed to 47 to 49%, roughly 86% of viewership still happens live (or within 24 hours of live), CTA click rates inside the session average around 22%, the typical B2B webinar pulls ~300 registrations per event, and more than 95% of B2B marketers now run webinars as a primary demand channel. Treat those five numbers as the floor, not the ceiling.
The 2026 TLDR Benchmarks Every Team Should Measure Against
Here are the numbers I pull up whenever a client asks me, “are we normal?” ⭐
- ✅ Attendance rate: 47 to 49% of registrants show up live (Univid 2026 report, based on 325K+ tracked attendees).
- ✅ Live vs. replay split: ~86% of total views happen live or within the first 24 hours; replay accounts for the remaining 12 to 14% and tails off past day 7.
- ✅ Avg registrations per event: ~300 for B2B webinars (Wavecnct 2026), with educational webinars skewing higher and product demos lower.
- ✅ CTA click rate in-session: ~22% of attendees click at least one timed offer or CTA overlay (ClickMeeting 2026 benchmark).
- ✅ B2B marketer adoption: 95%+ of B2B marketers run webinars in 2026; 73% cite them as the highest-quality lead source (HubSpot, Forrester 2026).
- ✅ Conversion by webinar type: Educational 15 to 25%, Sales 10 to 20%, Demo 20 to 30%, High-ticket coaching 5 to 12% attendee-to-action.
- ✅ Best day/time: Wednesday 11 AM to 2 PM ET consistently wins across B2B datasets.
- ✅ Evergreen share: Roughly 58% of marketers now run at least one evergreen or simulive funnel alongside live, up from ~40% three years ago.
Where Most Teams Are Actually Leaking
If your numbers are below those benchmarks, the problem is almost never the topic. It’s almost always scheduling architecture, follow-up segmentation, or a missing CTA inside the room. I’ve coached 100+ webinars and the leak is predictable: people obsess over registration volume and ignore stick rate and CTA timing, which is where the revenue actually moves. For deeper context on the full funnel, see our breakdown of what a webinar is and how it grows businesses.
How We Surface These Numbers Inside EasyWebinar
We built our webinar platform so every one of these benchmarks shows up per event, segmented by live, simulive, automated, and evergreen, without you stitching Zoom reports into a HubSpot dashboard every Monday. Registration rate, show-up rate, stick rate, drop-off timestamp, CTA clicks, and attendee-to-buyer conversion all live in one place, tied to the same attendee record your follow-up sequence will use. Proof comes from operators who’ve consolidated three-tool reporting stacks into one view:
“I love EasyWebinar’s support team… The detailed analytics are great as they save me the hassle of calculating KPIs, and the registration and email notification features are really handy.”
— Eliza W. Easywebinar G2 – Verified Review
“It is easy to set up call to actions and polls and easy to use them in both types of webinars. The analytics also show how many saw or clicked your offer.”
— Verified User in Professional Training & Coaching Easywebinar G2 – Verified Review
Q2: Why Are Most Webinar Analytics Dashboards Broken for Revenue Teams?
Most webinar analytics dashboards are broken because they measure the event, not the revenue system around it. Engagement data gets trapped inside a broadcast tool, registrations live in a CRM that doesn’t know what happened in the room, and revenue lands in Stripe. So nobody can answer “which webinar produced that closed-won deal” without a Monday-morning spreadsheet exercise.
The Monday-Morning Dashboard Problem
Here’s the scene I’ve watched play out at dozens of growth-stage marketing teams. Zoom exports a CSV of attendees. HubSpot pulls the registration list through a Zapier zap that breaks every other month. Stripe reports revenue in its own dashboard. ClickFunnels owns the landing page analytics. Restream reports multistream viewership separately. By Monday morning, the demand gen manager is stitching a Looker dashboard to answer a single question from the CFO: did the webinar work? And the honest answer is “sort of, probably, I think so.” That’s not analytics, that’s guessing with screenshots. 💸
Where Every Category Stops Short
The industry hasn’t ignored the problem. It’s just solved it in pieces that don’t connect.
- ❌ Zoom and GoTo Webinar capture attendance and session length cleanly, but produce zero funnel data: no registration-page conversion, no CTA attribution, no post-event behavioral tagging. They end at “the event happened.” See our EasyWebinar vs Zoom breakdown for a full capability audit.
- ❌ Demio and Livestorm report engagement beautifully inside the session, but have no native CRM, no built-in checkout, and no way to attach an engagement event to closed-won revenue without a third-party middleware layer. Demio runs $734/mo at 3K attendees: expensive to scale without the revenue workflow to justify it.
- ❌ ON24 does solve unified attribution, but at $30K+ ACV it’s priced out of the mid-market entirely. You pay for over-engineering you’ll never use.
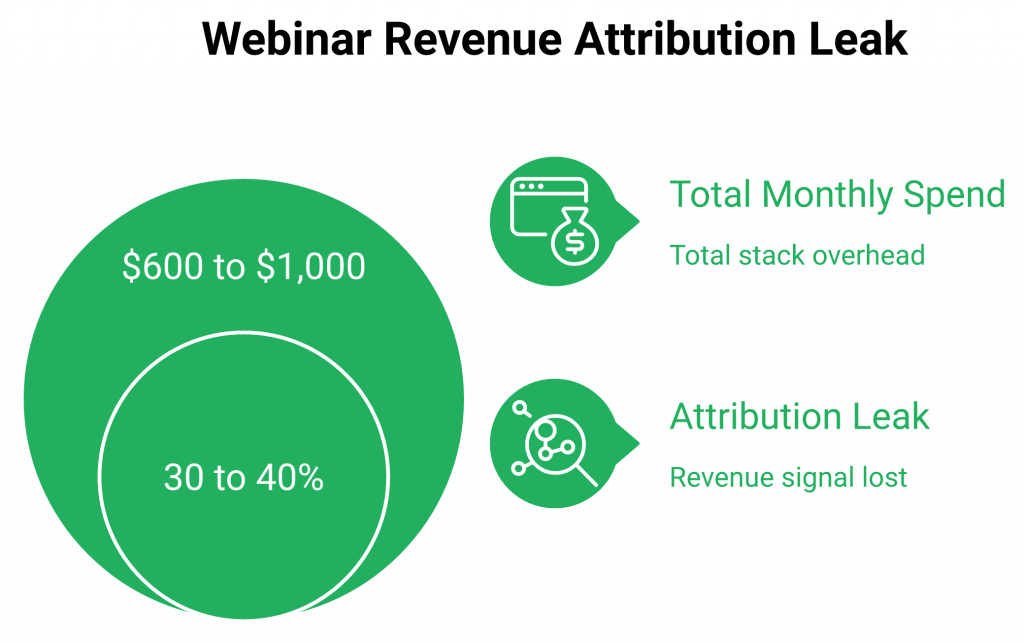
- ❌ The multi-tool stack (Zoom + ClickFunnels + HubSpot + Zapier + Stripe + Restream) is the most common competitor, and the most expensive. $600 to $1,000/month, five handoffs, and attribution that silently breaks every time a UTM gets stripped.
The Strategic Shift: Analytics as a Workflow Layer
Here’s the reframe that changes everything. Webinar analytics shouldn’t be a reporting layer you query after the fact. They should be a workflow layer that triggers action during and after the event. Every poll response, every CTA click, every 70%-watch threshold, every replay view should automatically tag the contact, trigger a follow-up sequence, and update a lead score inside the same system. Reporting is what you do when the data is already disconnected. Workflow is what you build when it isn’t. That’s the core argument behind webinar funnel automation for lead generation and sales.
How EasyWebinar’s Endpoint Ecosystem Closes the Loop
We designed EasyWebinar’s Endpoint Ecosystem so engagement data, EasyCRM lead scoring, and monetization events all live in one attribution model. When an attendee clicks a timed offer, the click tags them hot, drops them into the auto-dialer queue inside our native sales CRM, and shows up on the same revenue dashboard as the closed-won deal three weeks later. No Zapier, no CSV, no Monday-morning reconciliation. K21 Academy reported 3x click-through rates and 5x registrant growth after switching from a stitched stack to a single engagement-to-CRM workflow (see the full edtech case study).
“We’ve just started using EasyWebinar for our live and automated webinars, and it’s been an excellent experience… It is solving a big hole for us, our current webinar software is clunky, old, and not reliable.”
— Verified User in Information Services Easywebinar G2 – Verified Review
“It also seamlessly integrated with our CRM… Automating webinars that we used to have to run live every week and over time also saving us money, being more efficient.”
— Darrin B. Easywebinar G2 – Verified Review
Q3: Which Webinar KPIs and ROI Metrics Should You Track Across the Full Funnel?
Track 12 KPIs across four funnel stages: pre-webinar (registration rate, cost per registrant), attendance (show-up rate, session length, stick rate), engagement (poll participation, CTA CTR, drop-off timestamp), and post-webinar (MQL %, pipeline influenced, ROI, NPS). The ROI formula itself is straightforward: ROI = ((Pipeline Influenced × Close Rate × ACV − Total Cost) ÷ Total Cost) × 100.
The 12-KPI Funnel Framework With 2026 Benchmarks
| Stage | KPI | Formula | 2026 Benchmark | Diagnostic Action |
|---|---|---|---|---|
| Pre-webinar | Registration rate | Registrations ÷ Landing page visits | 25 to 35% cold traffic | Fix offer clarity and social proof |
| Pre-webinar | Cost per registrant (CPL) | Ad spend ÷ Registrations | $8 to 12 (Casey baseline) | Audit ad creative and back-end offer price |
| Attendance | Show-up rate | Attendees ÷ Registrants | 40 to 50% | Scheduling, reminders, timezone fit |
| Attendance | Session length | Avg minutes watched | 45 to 60 min | Fix pacing, add open loops |
| Attendance | Stick rate | % who stay through the pitch | 50 to 65% | Shorten sales portion, add bonus |
| Engagement | Poll participation | Poll responses ÷ Attendees | 35 to 45% | Ask earlier, make it low-effort |
| Engagement | CTA CTR | CTA clicks ÷ Attendees | 20 to 25% | Offer timing and countdown urgency |
| Engagement | Drop-off timestamp | Minute mark of largest exit | N/A, diagnostic | Rework the content at that moment |
| Post-webinar | MQL % | MQLs ÷ Attendees | 8 to 15% B2B | Fix behavioral follow-up segmentation |
| Post-webinar | Pipeline influenced | $ of oppties touched by webinar | N/A, track | Set attribution window |
| Post-webinar | ROI | Formula above | 3 to 10x for sales webinars | See below |
| Post-webinar | NPS | 0 to 10 recommendation scale | 40 to 60 | Content fit and pacing |
Building an Attribution Model That Actually Holds
ROI falls apart when the attribution model is lazy. Here’s the baseline:
- Define the attribution window: 30 days for transactional offers, 60 to 90 days for high-ticket coaching or enterprise.
- Standardize UTM taxonomy across every promotion channel so source attribution survives the handoff.
- Track registration source and tie it to the CRM contact record at creation, not via Monday-morning reconciliation.
- Separate first-touch, last-touch, and multi-touch views: use multi-touch for pipeline influenced; use last-touch for closed-won attribution.
- Include all costs: platform fees, ad spend, promotion time, speaker opportunity cost, and tooling overhead. Teams underestimate total cost by 30 to 40% because they forget the stack.
Why Engagement KPIs Predict Pipeline Better Than Attendance
Attendance is a vanity metric if you look at it alone. Engagement KPIs, specifically stick rate, CTA CTR, and drop-off timestamp, predict pipeline conversion far better because they tell you what the attendee did, not just that they showed up. ClickMeeting’s 2026 guidance, Contrast’s KPI framework, and Riverside’s ROI analysis all converge on the same point: the behavior during the webinar is the leading indicator. And stitched stacks break this reporting because Zapier latency, deduplication failures, and missing replay attribution make attendee-level behavioral data impossible to assemble reliably. For tool-level context, see our tools to increase webinar engagement guide.
How We Calculate All 12 KPIs Natively
EasyWebinar plus EasyCRM calculate each KPI automatically, attach every engagement event to the contact record, and tie closed-won revenue back to the originating webinar. No Zapier, no CSV exports. When Ryan Fenn built a $2M automated webinar funnel, the unlock wasn’t a better webinar, it was eliminating the Zoom + ClickFunnels + ActiveCampaign + Stripe attribution chain that had been breaking his ROI reporting every quarter. One platform, one contact timeline, one honest ROI number.
Q4: What Is a Good Webinar Conversion Rate in 2026, and How Do You Diagnose a Leaky Funnel?
A good 2026 webinar conversion rate is 15 to 30% attendee-to-action, varying by webinar type: educational 15 to 25%, sales 10 to 20%, demo 20 to 30%, high-ticket coaching 5 to 12%. Registration-to-revenue on paid traffic funnels runs 2 to 5%. If you’re below those ranges, the funnel is leaking at a specific stage, and the fix is almost always architectural, not creative.
Benchmark Ranges by Webinar Type
Not every webinar should be measured against the same bar. The 10% attendee-to-buyer target I teach is for sales webinars into mid-ticket programs. Here’s how the ranges actually split in 2026:
- ✅ Educational webinars (teach, no hard pitch): 15 to 25% attendee-to-email-capture or next-step action.
- ✅ Sales webinars (teach plus offer at the end): 10 to 20% attendee-to-buyer or attendee-to-call.
- ✅ Product demo webinars: 20 to 30% attendee-to-trial or demo request.
- ✅ High-ticket coaching ($2K to $25K offers): 5 to 12% attendee-to-application, 30 to 50% application-to-call, 20 to 40% call-to-close.
- ✅ Registration-to-revenue on paid traffic: 2 to 5% is healthy; above 5% means your offer-audience fit is dialed.
The Benchmark-to-Action Diagnostic Table
This is the table I keep on a sticky note. When a conversion number is low, don’t guess. Find the stage that’s below benchmark and fix that stage. ⚠️
| If your… | …is below | …then fix |
|---|---|---|
| Registration rate | 30% (cold traffic) | Landing page headline, offer clarity, and social proof above the fold |
| Show-up rate | 40% | Scheduling architecture: Just-in-Time, timezone-aware, 3+ reminders, show-up bonus |
| Stick rate | 50% | Pacing, open loops, shorten the sales portion, add end-of-webinar bonus |
| Poll participation | 35% | Ask the first poll in the first 5 minutes; make it low-effort |
| CTA CTR | 15% | Offer timing (introduce earlier), stacked CTAs, countdown urgency |
| Attendee-to-buyer | 10% | Offer-audience fit, price anchoring, live Q&A objection handling |
| MQL % | 8% | Follow-up segmentation: behavioral, not broadcast |
| Pipeline influenced | N/A | Attribution window, UTM taxonomy, and CRM tag discipline |
What the 2026 Data Confirms About Format
Oberlo, AEvent, and CloudPresent 2026 data all converge on the same pattern: evergreen and simulive formats consistently outperform pure-live on conversion when timed offers and behavioral follow-ups are preserved. Live still wins for high-ticket launches where Q&A objection handling matters, but automated funnels produce more consistent conversion because they remove the “I’m having an off day” variable. The sequencing I teach is the same one I’ve run for 14 years: go live first until you’re consistently hitting 10% attendee-to-buyer, then flip the same funnel to automated with one toggle and scale. For the format comparison in detail, read pre-recorded webinar platforms vs live.
Where EasyWebinar Operationalizes Each Diagnostic
We built the conversion levers directly into the room, not into a separate checkout tool. Timed offers with countdown scarcity hit the CTA-timing fix. Stacked CTAs at 45 min and 75 min hit the CTA-CTR fix. Behavior-based Power Follow-Ups inside EasyCRM hit the MQL-segmentation fix: someone who clicked the buy button but didn’t complete gets a different sequence than someone who watched 70% and left. Every diagnostic step above lives inside one workflow, not five, which is exactly why our paid webinars flow captures purchase intent in-session. 💰
“With my live class I used to sell 10-12 courses. With EasyWebinar I sold 25 courses within 3 weeks of my evergreen launch… This is an incredible tool that feels like a live class but takes away the exhaustion of showing up live, while also performing 100% better in terms of course revenue.”
— Laura C. Easywebinar G2 – Verified Review
“I love that we can have a poll, offer and countdown right in the event! That’s going to be so great for sales and interactions.”
— Verified User in Photography Easywebinar G2 – Verified Review
Q5: When Is the Best Day, Time, and Promotion Window to Maximize Webinar Attendance?
The highest-performing webinars in 2026 run Tuesday through Thursday, between 11 AM and 2 PM ET, with a 2 to 3 week promotion window and 4 to 5 reminder touches before the event. That combination consistently drives 40%+ show-up rates and a 2 to 3x registration lift versus a one-week promotion window. Timing is architecture, not taste. ⏰
The 2026 Timing and Promotion Benchmarks
I’ve tested this across a decade of client webinars, and the data pattern is remarkably consistent. For one of my EasyWebinar customers, Thursday and Sunday slots at noon and 6:30 to 7 PM local time outperformed every other combination, hitting East Coast lunchtime, Central dinnertime, and West Coast after-dinner windows in a single stream. The newer 2026 datasets (Univid, BigMarker, and ClickMeeting) confirm the same spine:
- Wednesday is the highest-attendance day across B2B datasets, followed closely by Tuesday and Thursday (Univid/BigMarker 2026). Mondays and Fridays underperform by 15 to 20%.
- 11 AM to 2 PM ET wins for single-timezone US audiences, because it captures East Coast lunchtime and West Coast late-morning in the same slot.
- Same-day registrations convert 60%+ to attendance. The shorter the gap between intent and event, the higher the show-up rate.
- 3+ reminder emails lift show-up by 18 to 22%. One at registration, one 24 hours out, and one 1 hour out at minimum. Five touches is the sweet spot for 2-week windows.
- Timezone-aware scheduling adds 12 to 15 points for global audiences versus a single fixed-time event.
- SMS reminders add another 8 to 10 points on top of email sequences.
- 2 to 3 week promotion windows outperform 1-week windows 2 to 3x on registrations. Beyond 3 weeks, decay starts outpacing new sign-ups.
- Show-up bonuses lift attendance 10 to 15% when announced on the thank-you page, not just in reminder emails.
The Architecture Fix vs. More Emails
Most teams respond to a weak show-up rate by piling on more reminder emails. That’s treating a symptom. The structural fix is collapsing the gap between intent and attendance, which is exactly what Just-in-Time scheduling does. When a registrant can join a session that starts within 15 minutes of signing up, the “I’ll remember to show up Thursday” problem disappears. For the full playbook on preparing a high-attendance session, see our complete host preparation guide.
How We Solve the Timing Problem Inside EasyWebinar
Our automated webinar Just-in-Time scheduling lets registrants join a session that begins within 15 minutes of sign-up, collapsing the registration-to-attendance gap entirely. For broader campaigns, timezone-aware recurring schedules mean attendees in Sydney and San Francisco both get convenient session times without you cloning events manually. Automated reminder emails still run, but they’re reinforcing an already-convenient experience, not compensating for an inconvenient one. K21 Academy hit a 47% show-up rate on EasyWebinar (well above the 25 to 35% industry average) by combining Just-in-Time scheduling with structured reminders and a show-up bonus that treated attendance as a system outcome, not an email metric. See the full edtech case study for the numbers. One platform. One toggle. Four formats (Live, Simulive, Automated, and Evergreen) running off the same schedule architecture.
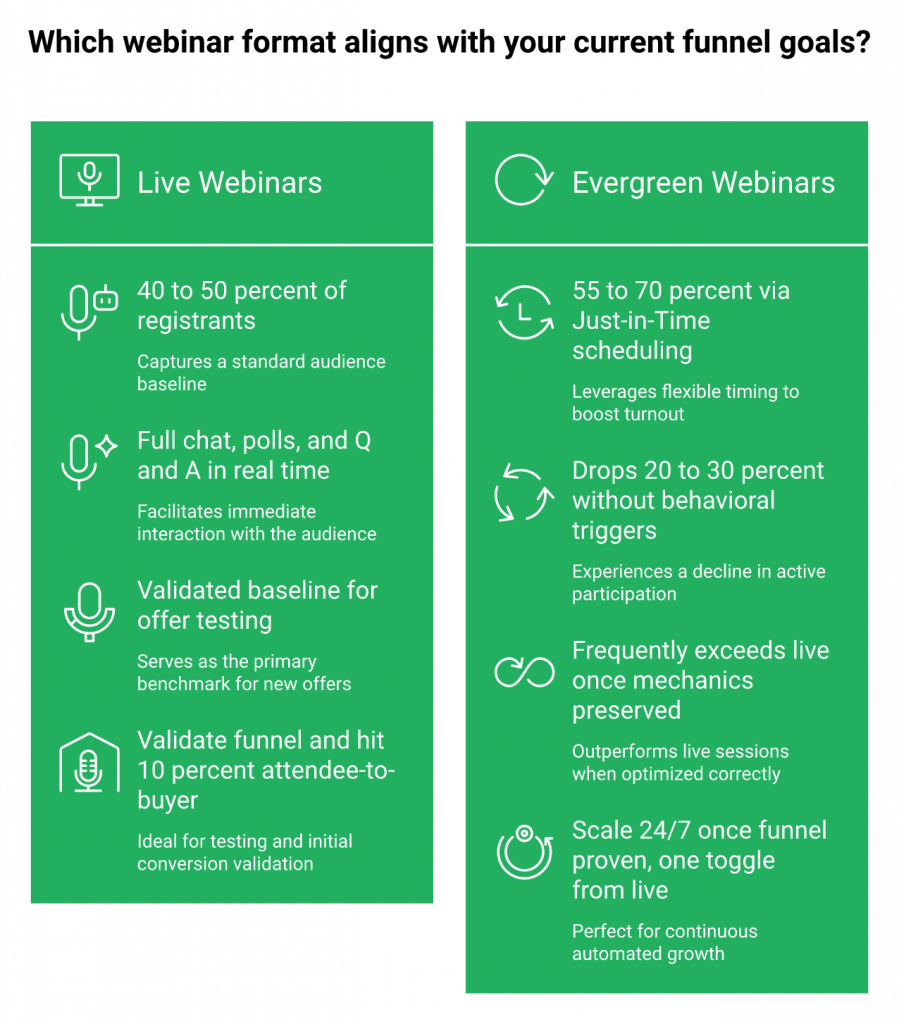
Q6: How Do Evergreen, Simulive, and Automated Webinar Statistics Differ From Live Benchmarks?
Evergreen and simulive webinars produce a fundamentally different benchmark curve than live. Attendance rates climb to 55 to 70% thanks to Just-in-Time scheduling (versus 40 to 50% live), engagement drops 20 to 30% unless behavioral triggers compensate, and revenue per registrant frequently exceeds live when the offer mechanics and timed CTAs are preserved. Blending those numbers with live benchmarks hides the real story. ⭐
Why the Industry Reports the Wrong Baseline
Most 2026 benchmark reports blend live and automated data into a single “webinar statistics” number, which leaves creators and marketing teams without a real baseline for the format that actually scales revenue 24/7. A 45% attendance number tells you nothing if half of that data came from Just-in-Time evergreen funnels and half came from Tuesday-at-noon live events. Operators running evergreen need format-specific numbers: attendance decay across the replay window, in-session CTA click timing, and watch-time drop-off at the offer moment. Those metrics don’t live in a dashboard that was designed for the “live event happened” mindset. For the broader format debate, see pre-recorded webinar platforms vs live.
Where Every Category Leaves Evergreen Analytics Short
The platform landscape doesn’t help.
❌ Zoom and GoTo Webinar don’t offer evergreen at all. You’d have to stitch a video player, plus a scheduling tool, plus a reminder system to approximate it. See our EasyWebinar vs GoToWebinar breakdown.
❌ Demio and Livestorm treat automation as a secondary feature. Their analytics depth on evergreen-specific metrics (watch-time decay, replay-window conversion) is shallow compared to their live reporting. Full capability audit in our EasyWebinar vs Demio comparison.
❌ eWebinar isolates the simulated-interaction use case at $99/mo for limited attendees. Clever, but narrow, and without native monetization infrastructure.
❌ WebinarKit runs evergreen well and prices aggressively, but can’t host live. So you can’t validate a funnel before scaling it.
The Strategic Shift: Evergreen Needs Its Own Metric Set
Evergreen analytics require metrics that don’t exist in live-only dashboards: watch-time decay curves, CTA click timing within the recorded session, replay-window conversion by day, and drop-off timestamps mapped to the recording rather than the calendar. My rule for every client is the same: go live first until you’re consistently hitting 10% attendee-to-buyer, then flip the same funnel to automated with one toggle and scale. These aren’t separate products. They’re lifecycle stages of one asset. And the data you need changes when the format changes. For the strategic playbook, read automated webinars for passive income.
How EasyWebinar Produces Format-Specific Benchmarks
We built EasyWebinar so Automated Gold, Just-in-Time scheduling, and in-session CTA analytics produce the evergreen-specific data this category is missing. You see attendance separately for live versus replay, watch-time decay against the recording timeline, and CTA click timing down to the minute, so you know which offer position converts and which one needs to move. Carla Biesinger generated $5M from a single EasyWebinar evergreen funnel running one pre-recorded webinar on automated scheduling with in-webinar offers and behavioral follow-ups doing the selling 24/7. Read the full course creator case study. That’s what format-specific analytics unlock.
“I used to do live webinars to sell my online course. I decided to do an evergreen webinar instead using EasyWebinar. With my live class I used to sell 10-12 courses. With EasyWebinar I sold 25 courses within 3 weeks of my evergreen launch.”
— Laura C. Easywebinar G2 – Verified Review
“EasyWebinar is hands-down THE webinar platform for evergreen webinars, no contest… it splits out live and replay attendee insights for evergreen webinars.”
— Ash A. Easywebinar G2 – Verified Review
Q7: How Do You Choose Event Analytics Software That Connects to Your Revenue Workflow (Including Enterprise Requirements)?
Choose event analytics software by whether it closes the loop between engagement data and revenue action, not by dashboard aesthetics. Native CRM integration, in-session monetization tracking, and (for enterprise) SOC 2 Type II plus SSO/SAML are the architectural criteria that separate a reporting tool from a revenue system. Everything else is secondary.
The Decision Dilemma Most Teams Get Wrong
Mid-market and enterprise buyers face 40+ analytics tools, and most of them optimize for the wrong thing: dashboard beauty instead of workflow completeness. The stakes are real. Broken attribution, inflated CAC, and CFO friction when nobody can explain which channel drove which deal. This is a high-consequence decision disguised as a procurement checklist. ⚠️ For a side-by-side view of options, see our best webinar software comparison guide.
The Wrong Criteria Most Buyers Default To
Brand recognition (Zoom), dashboard visuals (Livestorm), cheapest price (WebinarKit), most integrations (the Zapier trap), or most features (ON24, over-engineered at $30K+ ACV). Each of those criteria misses the same architectural question: does the data move from the webinar into a revenue action automatically, or does it require a human to export, reconcile, and route it? If the answer involves a spreadsheet, the tool isn’t an analytics system. It’s a reporting tool.
The Right Evaluation Framework (9 Criteria)
Score any platform against these nine criteria. Platforms hitting 7+ represent a genuine revenue system. Below 5, you’re buying a reporting tool.
| # | Criterion | EasyWebinar | Why it matters |
|---|---|---|---|
| 1 | Native CRM with lead scoring | ✅ | Eliminates the HubSpot + Zapier middleware layer |
| 2 | In-session monetization tracking | ✅ | Ties CTA clicks to closed-won revenue |
| 3 | Evergreen/simulive analytics depth | ✅ | Format-specific watch-time and CTA data |
| 4 | Behavior-based segmentation triggers | ✅ | Hot/Warm/Nurture tagging from in-webinar actions |
| 5 | Attribution window control | ✅ | 30/60/90-day windows configurable |
| 6 | GA4 / HubSpot integration | ✅ | UTM fidelity preserved across the funnel |
| 7 | SOC 2 Type II compliance | ✅ | Non-negotiable for enterprise procurement |
| 8 | SSO/SAML support | ✅ | Identity-layer compatibility at scale |
| 9 | Sub-account reporting + API | ✅ | Multi-team rollups and BI warehouse export |
The Meta-Insight Most Frameworks Miss
The real question isn’t “which dashboard is prettiest.” It’s “which system eliminates the export-to-spreadsheet step.” That’s the architectural fork. Everything else is a preference.
Where EasyWebinar Lands on the Framework
EasyWebinar’s Endpoint Ecosystem, which includes the AI webinar builder, EasyCRM with native lead scoring and auto-dialer, in-platform monetization, and EasyCast multistreaming, hits all nine criteria inside one subscription. The Unlimited tier carries SOC 2 Type II, SSO/SAML, sub-account management, and API access for enterprise readiness at a fraction of ON24’s $30K+ ACV. See our webinar pricing for the full breakdown. Enterprise clients including Dolby, Teachable, Keap, and AWeber run on the platform at organizational scale.
“Weve been using EasyWebinar for a long time, and weve been very happy with the platform. The app is user-friendly and reliable, making it easy for us to host webinars and automate our processes.”
— Jo K. Easywebinar G2 – Verified Review
“It also seamlessly integrated with our CRM… Automating webinars that we used to have to run live every week and over time also saving us money, being more efficient.”
— Darrin B. Easywebinar G2 – Verified Review
Q8: What Post-Webinar Survey Questions Actually Predict Revenue and Retention?
Effective post-webinar surveys ask 6 to 10 questions mapped to three outcomes: content fit (NPS, CES), buying intent (timeline, budget, and decision role), and operational feedback (pacing, tech quality, and replay preference). Generic “rate this webinar 1 to 5” surveys produce no pipeline signal. They produce a vanity score. A well-designed survey is a lead-scoring instrument, not a feedback form. ⭐
The Three-Outcome Question Library
Here’s the question bank I use across client funnels. Six to ten questions maximum, because longer surveys collapse completion rates below 30%.
1. Content Fit (2 to 3 questions)
- “On a scale of 0 to 10, how likely are you to recommend this session to a peer?” (NPS)
- “How easy was it to get the outcome you came for?” (1 to 7 scale, CES)
- “What was the single most useful idea you’re taking away?” (open-ended)
2. Buying Intent (3 to 4 questions, the revenue-predictive core)
- “What’s preventing you from solving this problem today?” (open-ended, surfaces objections)
- “Which outcome would make this solution a priority in the next 90 days?” (open-ended)
- “When are you looking to make a decision?” (Now / 30 days / 60 to 90 days / Exploring)
- “What’s your role in the buying decision?” (Decision-maker / Influencer / Evaluator / Not involved)
3. Action (1 to 2 questions)
- “What’s the best next step for you?” (Book a call / Start trial / Get resources / Not ready)
- “If you missed anything, would you prefer a replay, a summary, or a 1-on-1 walkthrough?”
Scoring Logic That Turns Answers Into Pipeline
Score each response to produce a lead-fit number, not just a feedback average. NPS 9 to 10 = promoter, tag hot. Decision timeline “Now” or “30 days” combined with decision-maker role = sales-accepted lead. Open-ended intent answers that reference a specific outcome (revenue, time, or team) outperform rating scales by 2 to 3x in predicting close rate. ClickMeeting and Contrast 2026 survey design guidance both confirm this. Rating scales tell you how someone felt; open-ended intent questions tell you what they’re going to do. For a deeper look at engagement-to-pipeline mechanics, see interactive webinars that drive 5x engagement.
Why Open-Ended Questions Outperform Ratings
Rating scales produce an average. Open-ended intent responses produce language, the exact words your next ad headline, email subject line, and sales call opener should use. A “7/10” means nothing actionable. “I can’t scale without hiring three more reps” is an ICP match and a sales hook. Every question in the intent category should be open-ended for that reason.
How We Turn Survey Responses Into Revenue Actions
EasyWebinar captures every survey response against the attendee’s EasyCRM record automatically, which is why our native sales CRM is the linchpin of the revenue workflow. Promoter-scored NPS responses auto-tag hot. “30-day timeline + decision-maker” triggers an auto-dialer queue entry for the sales team. “Not ready” responses route into a replay nurture sequence with behavioral segmentation. The survey stops being a Google Form and becomes a lead-scoring input feeding the same workflow that ran the webinar: no CSV export, no separate survey tool, and no lost signal between tools. 💰 Ready to see it in action? Request a demo.
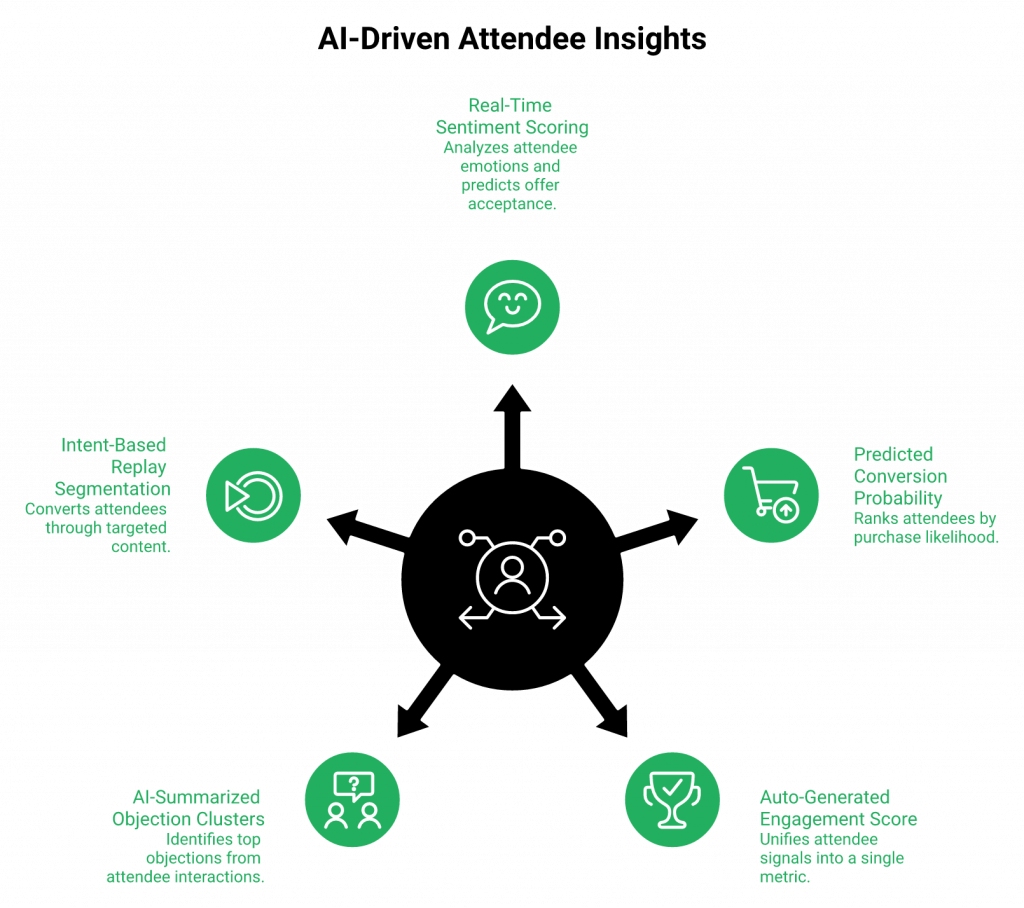
Q9: What AI-Era Webinar Metrics Will Define Performance in 2026 and Beyond?
The five AI-era webinar metrics redefining performance in 2026 are real-time sentiment scoring, predicted conversion probability per attendee, auto-generated engagement scores, AI-summarized objection clusters from chat and Q&A, and intent-based replay segmentation. These aren’t replacements for the classic funnel KPIs. They’re a new layer that tells you who’s likely to buy, not just what happened. ⭐
The Five Metrics That Change the Follow-Up Game
Traditional KPIs like show-up rate and CTA CTR tell you what the room did in aggregate. AI-era metrics tell you what the individual attendee is about to do. The shift matters because follow-up is the single biggest revenue leak in most funnels, and broadcast-style email sequences are the reason. For more on the engagement layer these models feed on, see how to 10x engagement with webinar tools.
✅ Real-time sentiment scoring: NLP models analyze chat messages and poll open-text responses to produce a per-attendee sentiment score. Early 2026 studies show sentiment correlating with offer acceptance at r=0.6+, strong enough to use as a lead-scoring input.
✅ Predicted conversion probability: A model ranks each attendee by likelihood to purchase based on watch depth, chat activity, CTA hovers, and poll engagement. Teams pairing this with behavioral follow-up report a 25 to 35% lift in sales-accepted leads.
✅ Auto-generated engagement scores: Instead of manually weighting “poll answered = 2 pts, CTA clicked = 5 pts,” the model produces a single 0 to 100 engagement number that unifies every signal into one sortable column.
✅ AI-summarized objection clusters: Chat and Q&A transcripts get clustered into the top 3 objections in minutes. No analyst reading 400 messages Monday morning. Your next ad creative, email subject line, and sales opener come straight from that output.
✅ Intent-based replay segmentation: Replay viewers get segmented by watch depth and CTA interaction. Generic “replay nurture” sequences convert at 2 to 3x lower rates than segmented ones, so the segmentation pays for itself on the first re-send.
Where AI Accelerates, Not Replaces, Strategy
AI compresses the launch, not the strategy. A prompt-to-funnel builder can ship a registration page, reminder sequence, and replay page in under 10 minutes, but the model still needs you to know your audience, your offer math, and your drop-off timestamps. Expect predicted-conversion models to be wrong 20 to 30% of the time in year one. Use them as a prioritization layer on top of behavioral data, not a replacement for it. ⚠️ See our AI funnel builder for what that acceleration looks like in practice.
How We Pipeline AI Signals Into Revenue Actions
EasyWebinar’s AI webinar builder creates launch-ready funnels in under 10 minutes from a single prompt, and EasyCRM pipelines AI-scored signals (sentiment, predicted conversion, engagement score, and objection cluster tags) directly into lead scoring and auto-dialer workflows. A hot-scored attendee lands in the sales team’s dialer queue automatically. A medium-intent replay viewer drops into a segmented nurture sequence with messaging matched to their top objection cluster. The AI isn’t a dashboard widget. It’s a workflow accelerator that reduces the export-sort-assign cycle to zero. Operators consolidating AI scoring, CRM, and follow-up into a single platform consistently report meaningful follow-up efficiency gains versus their prior Zoom + Zapier + scoring-add-on stacks. 💰 Explore the full sales CRM for context.
Q10: What Do High-Ticket Creator and Coaching Webinar Benchmarks Look Like?
High-ticket creator webinars, selling $2K to $25K offers, run on a different benchmark curve than B2B: 30 to 40% show-up rate, 40 to 55% watch-to-offer, 5 to 12% attendee-to-purchase, and $40 to $120 revenue per registrant. Evergreen and simulive funnels consistently outperform pure-live on cash collected once the funnel is validated. Applying B2B numbers to a coaching funnel will mislead you every time. ⭐
The High-Ticket Benchmark Curve
The creator economy runs on events. Courses, coaching, masterminds, and application-based programs are the primary revenue infrastructure for this segment, and the funnel math works differently because the offer is larger, the sales cycle is shorter, and the buyer is often the decision-maker. For the strategic case, read why webinars are the best way to sell online courses.
✅ Show-up rate: 30 to 40% (slightly lower than B2B because audiences are smaller and more self-selected)
✅ Watch-to-offer rate (stick rate): 40 to 55%. This is the number that matters most.
✅ Attendee-to-purchase: 5 to 12% for direct-buy offers, 3 to 8% for application-then-call offers.
✅ Revenue per registrant: $40 to $120 for evergreen high-ticket funnels with paid traffic.
✅ Cost per lead: $8 to 12 CPL is the baseline into a $5K to $10K program (back-end math determines what you can spend up front).
The Segment-Specific Playbook
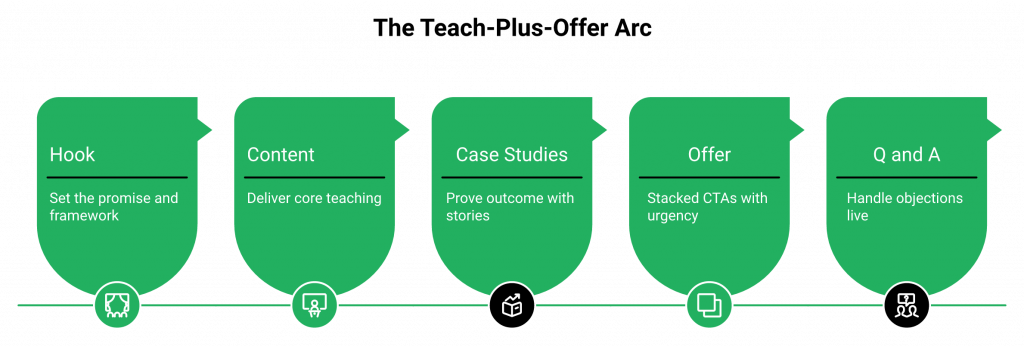
Here’s the arc I’ve coached across 100+ high-ticket webinars:
- Structure as a 60 to 90 minute teach-plus-offer arc: hook (5 min), content (30 to 40 min), case studies (10 to 15 min), offer (15 to 20 min), and Q&A (10 to 15 min). ⏰
- Use timed CTAs at the 45-minute and 75-minute marks: one introducing the offer, one with countdown urgency closing the window.
- Run 14-day replay windows with scarcity: replay plus bonus expiration plus cart close drives 30 to 40% of total revenue on most launches.
- Layer application calls for $5K+ offers: the application filters tire-kickers so your sales team only talks to qualified buyers. This is how we’ve closed $20M in coaching students across client funnels.
- Track four KPIs as distinct stages: show-up, watch-to-offer, offer-to-call (or offer-to-cart), and call-to-close. A low number at any stage tells you exactly where the leak is.
Why B2B Reports Mislead Creators
Generic benchmark reports blend enterprise B2B data with creator funnels, which produces misleading averages. A 10% attendee-to-buyer rate is elite for a $97 course and table stakes for a $5K coaching program. Don’t measure a creator funnel against an enterprise demo benchmark. For more revenue-specific context, read how to make money with webinars.
How EasyWebinar Supports the High-Ticket Arc Natively
We designed EasyWebinar’s in-platform ticketed access, timed offers with countdown scarcity, and EasyCRM auto-dialer to support exactly this arc. No ClickFunnels + Zoom + Kajabi triangle, no Stripe-handoff intent decay. Payments collect inside the webinar at peak intent through our paid webinars flow. Hot-scored applicants land in the dialer queue automatically. Carla Biesinger generated $5M from a single EasyWebinar evergreen funnel (see the full course creator case study), and Ryan Fenn built a $2M automated webinar funnel after replacing a duct-taped stack of Zoom, ClickFunnels, ActiveCampaign, and Stripe. 💰
“With my live class I used to sell 10-12 courses. With EasyWebinar I sold 25 courses within 3 weeks of my evergreen launch… it has been worth it for me to invest in that.”
— Laura C. Easywebinar G2 – Verified Review
“I’ve been using EasyWebinar to automate my webinars and drive course sales, and it’s been a total game-changer… It keeps the whole funnel cohesive and hands-free.”
— Jennifer B. Easywebinar G2 – Verified Review
Q11: Frequently Asked Questions About Webinar Statistics and Analytics
This FAQ resolves the most-searched People Also Ask queries on webinar statistics in 2026 (attendance rate, conversion rate, ideal length, success measurement, and survey design) in a snippet-friendly format built for quick reference and AI answer engines. Each answer cites a 2026 source (Univid, Wavecnct, ClickMeeting, HubSpot, or Forrester) for verification.
The Top Webinar Statistics Questions Answered
1. What is the average webinar attendance rate in 2026?
The average webinar attendance rate in 2026 is 47 to 49% of registrants, based on Univid’s analysis of 325K+ tracked attendees. B2B webinars trend slightly lower (40 to 45%). Creator and coaching webinars trend higher (50 to 60%) when Just-in-Time scheduling is used.
2. What is a good webinar conversion rate?
A good webinar conversion rate in 2026 is 15 to 30% attendee-to-action, varying by type: educational 15 to 25%, sales 10 to 20%, demo 20 to 30%, and high-ticket coaching 5 to 12% (ClickMeeting, AEvent 2026 data). Registration-to-revenue averages 2 to 5% for paid-traffic funnels.
3. How long should a webinar be?
Effective webinars run 45 to 75 minutes. The sweet spot for B2B is 45 to 60 min, and for high-ticket creator offers 60 to 90 min including Q&A. Sessions beyond 90 minutes see stick rates drop sharply (Wavecnct 2026). For setup mechanics, see how to start a webinar.
4. What percentage of webinar registrants actually attend?
About 47 to 49% of registrants attend live, with another 12 to 14% watching the replay within 7 days. The live plus replay combined viewership averages 60 to 65% of registrants (Univid 2026).
5. How do you measure webinar success?
Measure success across 12 KPIs in four funnel stages: registration rate, CPL, show-up rate, stick rate, poll participation, CTA CTR, drop-off timestamp, MQL %, pipeline influenced, ROI, NPS, and attendee-to-buyer conversion. No single metric is sufficient (HubSpot, Forrester 2026).
6. What is the best day and time to host a webinar?
Tuesday through Thursday, 11 AM to 2 PM ET, consistently wins for US B2B audiences. Wednesday is the highest-attendance day across Univid and BigMarker 2026 datasets. Timezone-aware scheduling adds 12 to 15 points for global audiences.
7. How do you calculate webinar ROI?
Webinar ROI = ((Pipeline Influenced × Close Rate × ACV − Total Cost) ÷ Total Cost) × 100. Include platform, ad spend, promotion, speaker time, and tooling costs. Teams underestimate total cost by 30 to 40%.
8. What are the top webinar KPIs to track?
The top five webinar KPIs are show-up rate, stick rate, CTA click-through rate, attendee-to-buyer conversion, and pipeline influenced. Engagement KPIs predict pipeline better than attendance alone (ClickMeeting, Contrast 2026).
9. Do evergreen webinars perform better than live?
Evergreen webinars often hit 55 to 70% attendance via Just-in-Time scheduling (versus 40 to 50% live) and can exceed live on revenue per registrant when offer mechanics are preserved. However, engagement drops 20 to 30% unless behavioral triggers compensate. See automated webinars for passive income for the operator playbook.
10. What questions should a post-webinar survey ask?
6 to 10 questions across content fit (NPS, CES), buying intent (timeline, budget, and decision role), and operational feedback (pacing, tech, and replay preference). Open-ended intent questions outperform rating scales 2 to 3x for revenue forecasting.
How EasyWebinar Surfaces These Numbers Natively
Every data point in this FAQ (attendance, stick rate, CTA CTR, ROI, NPS, and attribution) surfaces automatically inside EasyWebinar’s native analytics dashboard and EasyCRM. No external tools, no CSV stitching, and no Monday-morning reconciliation. You see the numbers the way the industry measures them, segmented by live, simulive, automated, and evergreen formats. Browse all features for the full picture.
Q12: Ready to Turn Webinar Statistics Into a Revenue System?
The gap between tracking webinar statistics and turning them into revenue is an infrastructure gap, not an analytics gap. One platform where analytics, CRM, monetization, and follow-up live together closes it. EasyWebinar is that webinar platform. ⭐
Every Benchmark in This Article Is Achievable
Every number you’ve just read (47% show-up, 22% CTA CTR, 10% attendee-to-buyer, and $5M from one evergreen funnel) is achievable. The question isn’t whether the benchmarks are real. The question is whether your stack lets the numbers compound or leaks them at every handoff. Teams running 5 to 7 disconnected tools average 30 to 40% attribution loss between ad click and closed-won revenue. That’s not a reporting problem. That’s $600 to $1,000/month paying for the leak. 💸 For a broader comparison view, see our compare webinar platforms page.
One Platform, Not a Stitched Stack
EasyWebinar’s Endpoint Ecosystem replaces the duct-taped combination of Zoom + ClickFunnels + HubSpot + Zapier + Stripe + Restream with one workflow where registration, engagement, monetization, and follow-up live inside the same contact record. The webinar stops being a marketing event that feeds a separate sales process. It becomes the sales process. See webinar pricing to compare tiers.
Turn These Benchmarks Into Your Own Numbers
Replace your 5-tool webinar stack with one Endpoint Ecosystem: AI Webinar Builder, EasyCRM, native monetization, and unified attribution.
- → Start Free 14-Day Trial, launch your first AI-built webinar in under 10 minutes
- → Book a Strategy Demo, see your funnel modeled on EasyWebinar in 30 minutes
- → Compare Pricing, see how Unlimited replaces $600 to $1,000/mo of stitched tools
The Proof Is in the Operators, Not the Pitch
Dolby, Teachable, Keap, and AWeber run on EasyWebinar at organizational scale. Carla Biesinger generated $5M from one evergreen funnel. Ryan Fenn built a $2M automated webinar funnel after eliminating a Zoom + ClickFunnels + ActiveCampaign + Stripe stack. K21 Academy grew registrations 5x and hit a 47% show-up rate on automated sessions (full edtech case study). Rick Mulready achieved 166% ROI on Facebook ads driving automated webinars. The webinar isn’t the experiment anymore. The stack is.
Was this post helpful?

Related Posts